|
Script Author: Ian Rivard
Description: ILT Calc screens curved composite laminates for interlaminar tensile (ILT) failure by computing the through-thickness normal stress σ_r at every shell element, using Kedward's curved-beam approximation extended to double-curved geometry. Curvatures come from the CAD surface when geometry is available, or from a mesh-based estimator when it isn't. One run produces σ_ILT (and optionally an energy-release-rate field) on every selected output set, ready for fringe-plot review against your material allowable.
What ILT failure looks like, and why curvature drives it: In a flat laminated composite plate under pure in-plane load, the through-thickness normal stress σ_r is essentially zero. Curve the laminate and apply a bending moment and σ_r becomes nonzero — the bending stresses, which want to be straight along their lines of action, get coupled into a through-thickness pull as they wrap around the radius. It's the same mechanics as the hoop tension in a curved chain link. That through-thickness stress tries to pry the plies apart. Carbon-fiber and glass-fiber laminates are matrix-dominated through the thickness — the matrix allowable in tension is typically a few ksi, an order of magnitude lower than the fiber-direction allowables. So σ_r → ILT failure is the leading mode at radius bends, ply drop-offs, frame mouseholes, the radius corners of stiffeners, dome regions on aerospace fairings, and the curved face-sheets of sandwich panels. Sign matters: tensile σ_r drives delamination; compressive σ_r is benign (it actually clamps the plies together).
Kedward's equation: For a thin curved laminate (thickness t, mean radius R) under pure bending moment per unit length M, the maximum through-thickness normal stress is: σ_r,max ≈ 3·M / (2·t·R) This is Kedward 1989 (Kedward, Wilson, McLean) — the workhorse approximation used industry-wide for radius ILT screening for ~35 years. With actual inner/outer radii R_i and R_o (which depend on where the laminate sits relative to the geometric reference radius), the form generalizes to: σ_r,max ≈ -3·sign(k) · √(k_i·k_o) · M / (2·t) where k = 1/R (curvature) and: k_i = 1/(1/k − offset − t) The offset accounts for the laminate sitting on either the convex or concave side of the geometric reference radius — a critical detail that flips the sign of σ_r and is the #1 source of silent ILT errors. Assumptions baked into Kedward:
Where Kedward breaks down:
ILT Calc gives you σ_r — the screening-level stress quantity. Final margin work for certification needs solid submodels with a mixed-mode failure criterion.
Double curvature: Kedward's equation is a 1D derivation: one curvature, one bending moment. Real composite parts have two principal curvatures at most points (cylindrical-only being the special 1D case where one of them is zero). For double-curved geometry like a spherical cap, a saddle in a frame fitting, or the corner of a stiffener, the bending moment has to be projected onto each principal-curvature direction: σ_ILT = M_k1 · C_k1 + M_k2 · C_k2 where M_ki is the bending moment per unit length resolved in the principal-curvature direction k̂_i, and C_ki is the Kedward geometric factor C_k = -3·sign(k)·√(k_i·k_o)/(2·t) for that curvature. This is reasonable for engineering screening but not rigorously derived for double-curved geometry in the literature. It works because the two principal curvatures are independent (eigenvectors of the surface shape operator) and the moment tensor decomposes onto them linearly. Don't trust it as a final margin tool in regions where both principal curvatures are large; validate against a 3D solid model on at least one representative double-curved coupon for any new layup or material.
Sign convention — the one detail to validate: Positive k₁ / k₂ correspond to the surface curving toward the FE element normal (which is set by node ordering on the element). With PCOMP offset placing the laminate on the convex side (offset = -t/2), positive σ_ILT under inward bending moment correctly indicates tension on the inner laminate face — the delamination-driving direction. Flip the offset to +t/2 (laminate on concave side) and σ_ILT should reverse sign for the same bending state. To validate sign on your own model:
If sign reverses unexpectedly on your real model, check the PCOMP offset against your laminate definition. That's the failure mode 99% of the time. Real laminates have a tool side and a bag side, and PCOMP offset has to encode which one is which.
How ILT Calc fits into best-practice ILT analysis: In aerospace primary-structure analysis (circa 2025), ILT screening generally goes:
ILT Calc is appropriate for step 1 only. Don't use it as a final margin tool. Hand off any hot-spot regions to a submodel.
Use Instructions: Run ILT Calc from the FEMAP toolbar. The dialog asks for:
After OK, pick the shell elements to evaluate (typically the entire composite shell region). If ILT Stress or ERR is on, you'll then be prompted to pick the output sets to process. The tool writes 21 curvature output vectors into a new output set named "ILT Radius Info", plus σ_ILT (vector 9100001) into each user-selected output set, plus G (vector 9100002) if ERR was enabled.
Mesh quality: When CAD geometry is associated with the elements, ILT Calc evaluates curvature analytically from the surface. Mesh density doesn't matter for curvature accuracy — only for moment-projection accuracy, which is much less sensitive. Reasonable mesh density (aspect ratio ≤ 3:1, no severely warped quads) is sufficient. When the mesh-fit path is used (no CAD or "Mesh only" mode), curvature accuracy depends on mesh density:
Practical thresholds: ≥6 elements through any curvature region for ≤5% error (recommended), ≥4 for engineering screening. In all cases: PCOMP offset must match the actual side of your laminate. This is by far the most common source of wrong σ_ILT.
Output vectors: In the "ILT Radius Info" output set:
In each user-selected output set:
Margin = (Z_t / max σ_ILT) − 1. Anything within 80% of allowable: build a 3D solid submodel.
Flagged Element Groups:
References:
Acknowledgments: Inspiration for this script comes from Joaquin Gutierrez — Thanks Joaquin!
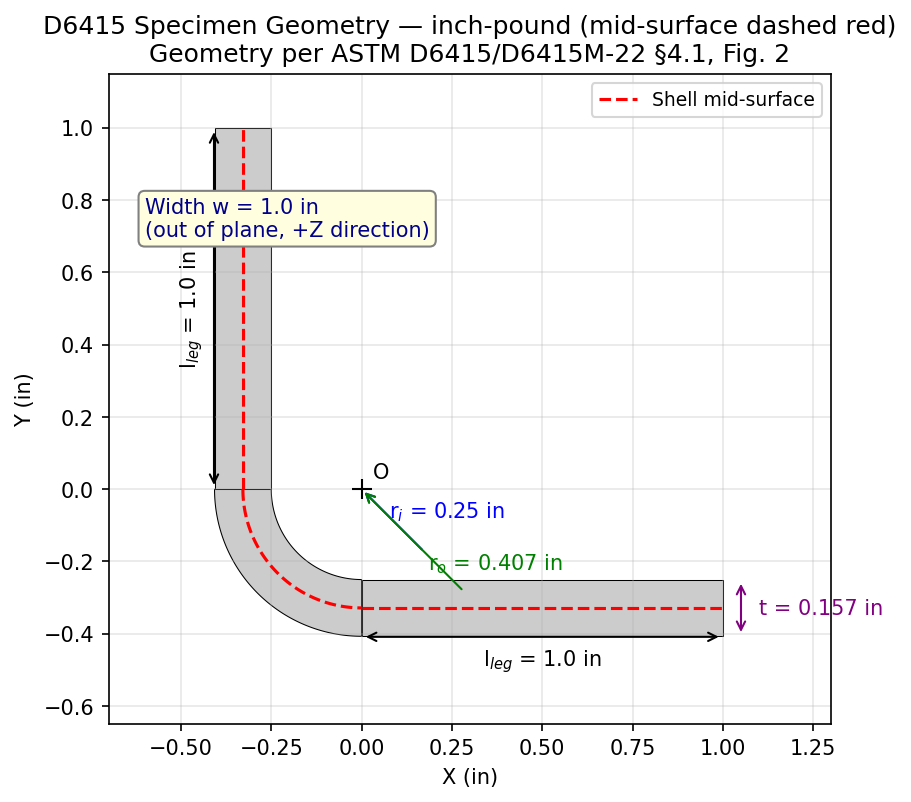
Advanced Users: To our users: We appreciate feedback on our tools and encourage you to modify them to your specific needs. If you make an improvement you feel would be valuable to others, please submit it through our contribution page. Validation Example: ASTM D6415 Curved-Beam SpecimenThe tool's accuracy is validated against the ASTM D6415 closed-form solution on a quarter-arc IM7/8552 [0]16 specimen. Two complementary FE decks both impose the same 100 in-lb bending moment in the curve and should converge on the same peak ILT stress. Specimen geometry
Figure V1 — ASTM D6415 specimen geometry: ri=0.25", t=0.157", b=1.0", 90° bend. Theoretical stress prediction
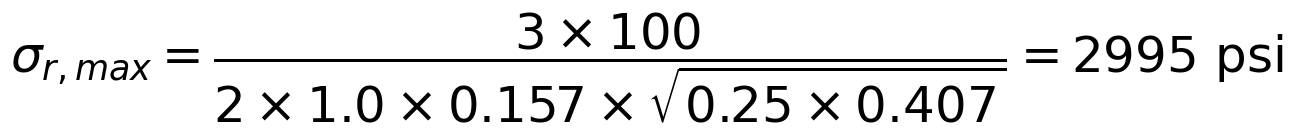
Plug in our values and you get 2,995 psi as the analytical target. Sample Bulk Decks:
Results
Figure V2 — D6415_simple_end_moment.dat: ILT stress contour, peak 3,108.9 psi at the curve apex. Compare to Kedward analytical 2,995 psi (+3.8%).
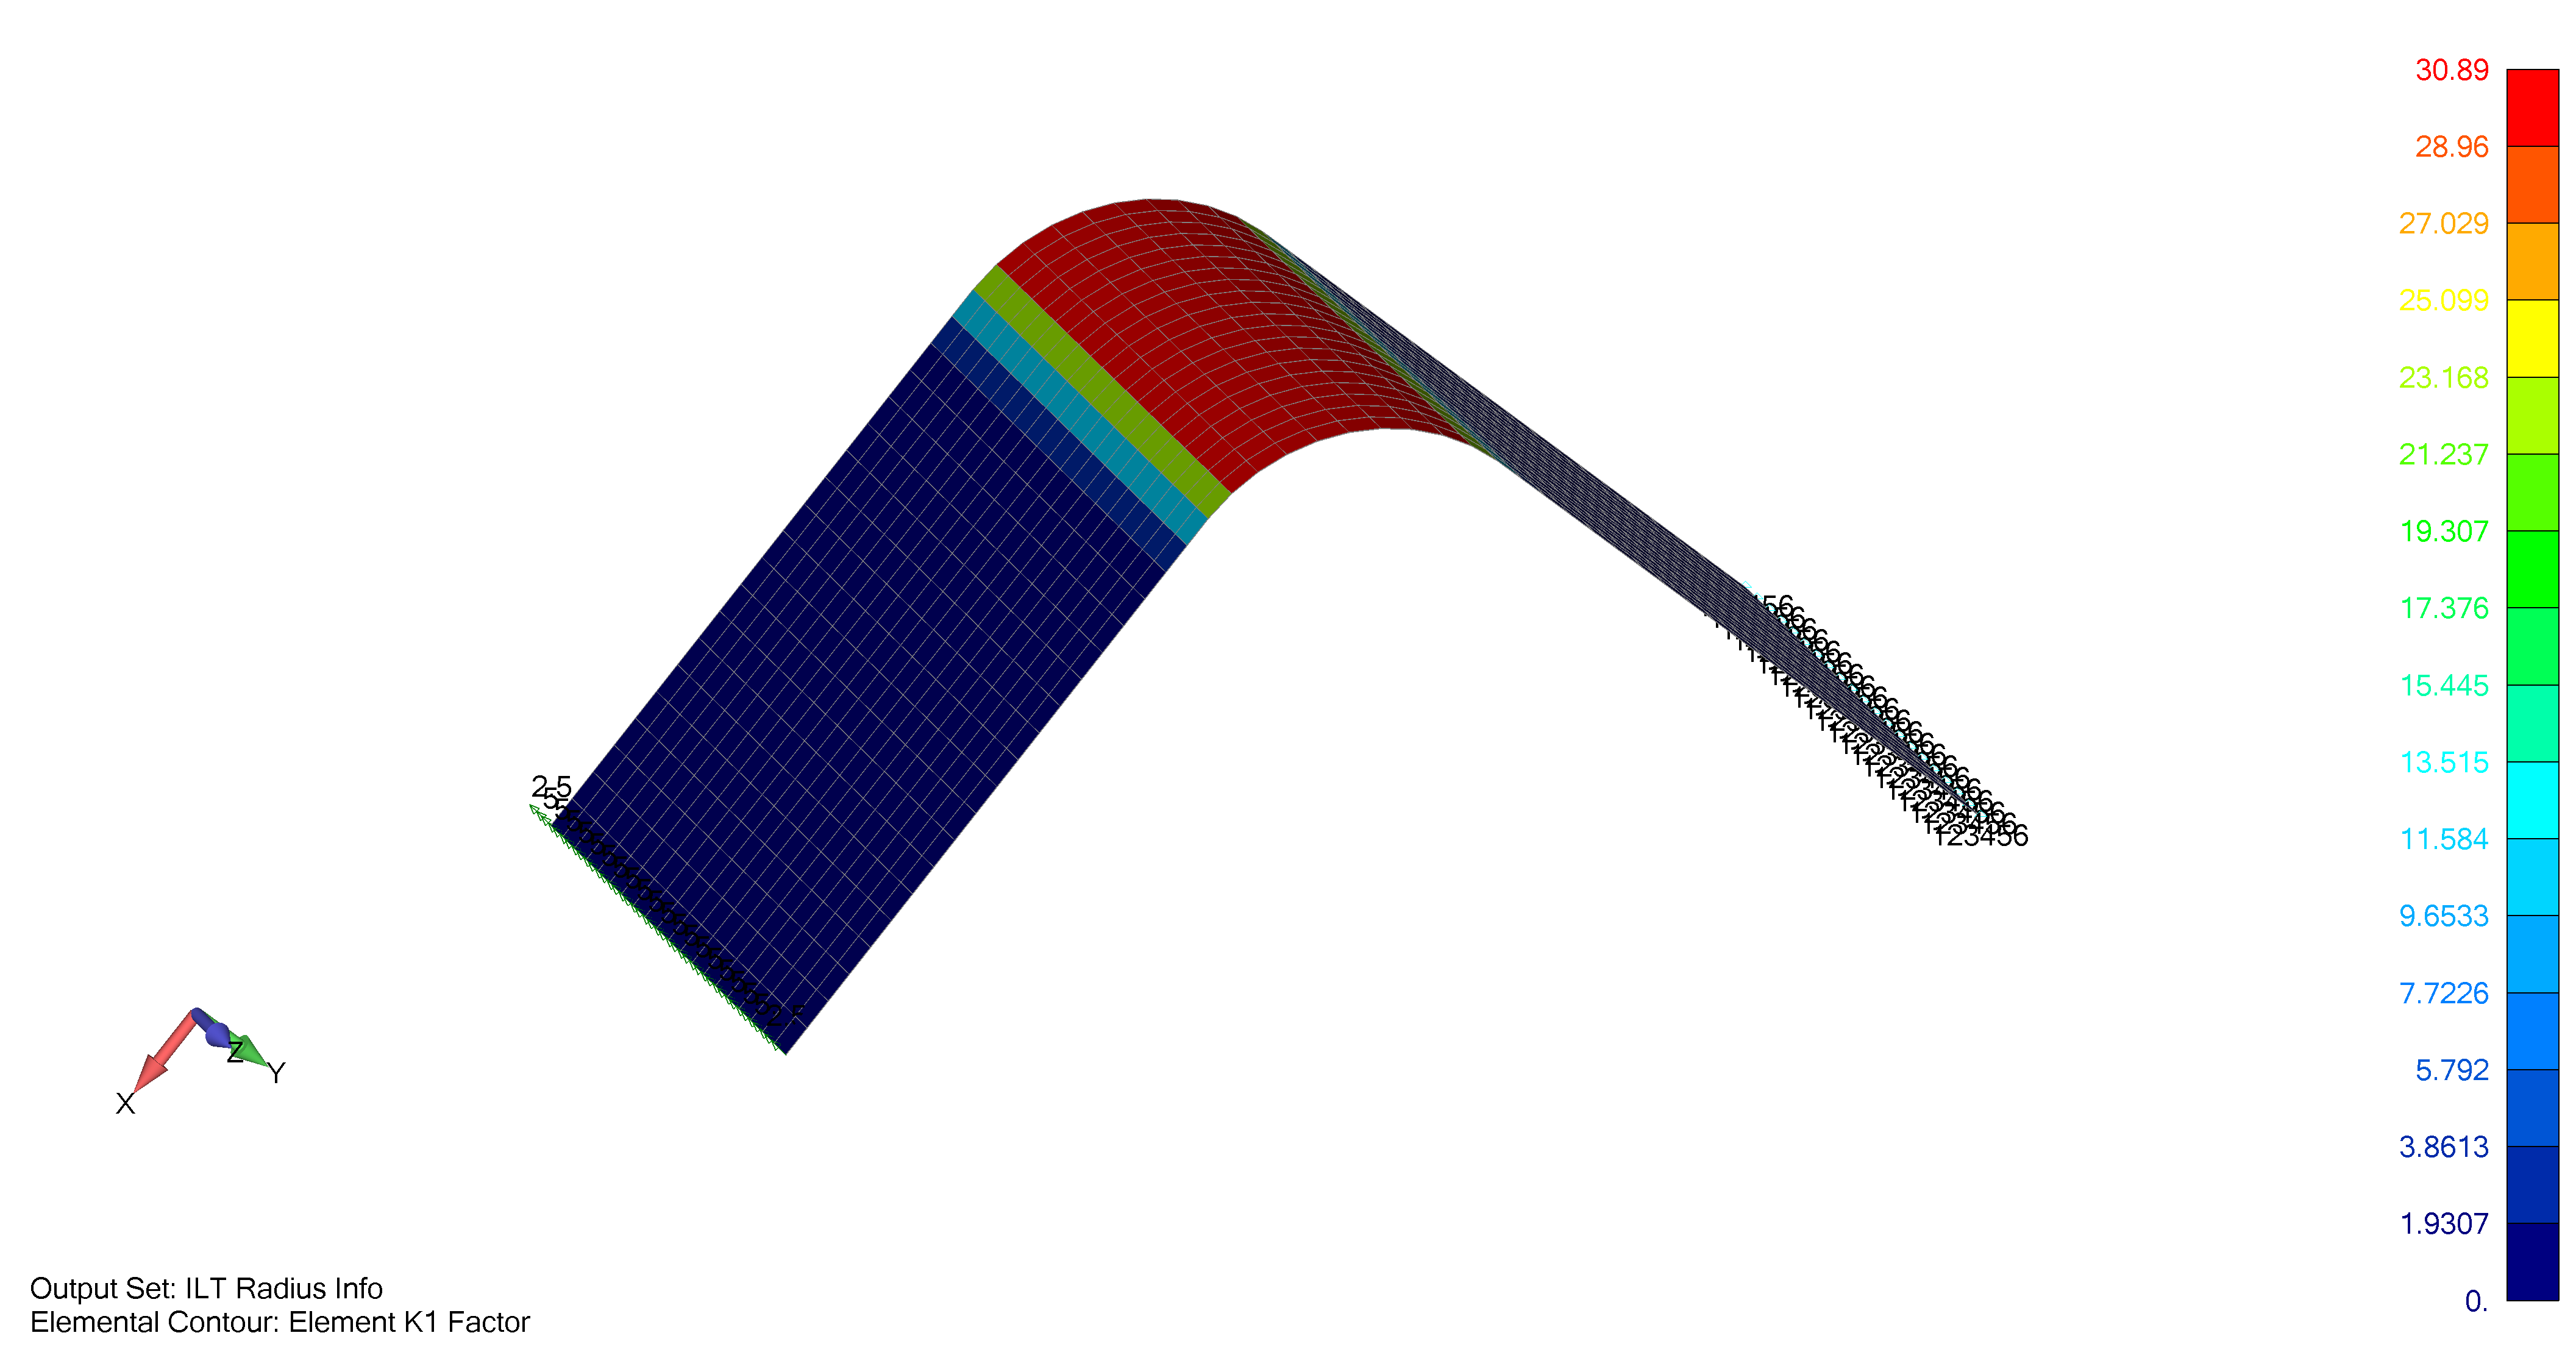
Figure V3 — Same deck: K1 curvature-factor diagnostic, confirming the bend-region curvature is correctly picked up from the CAD surface.
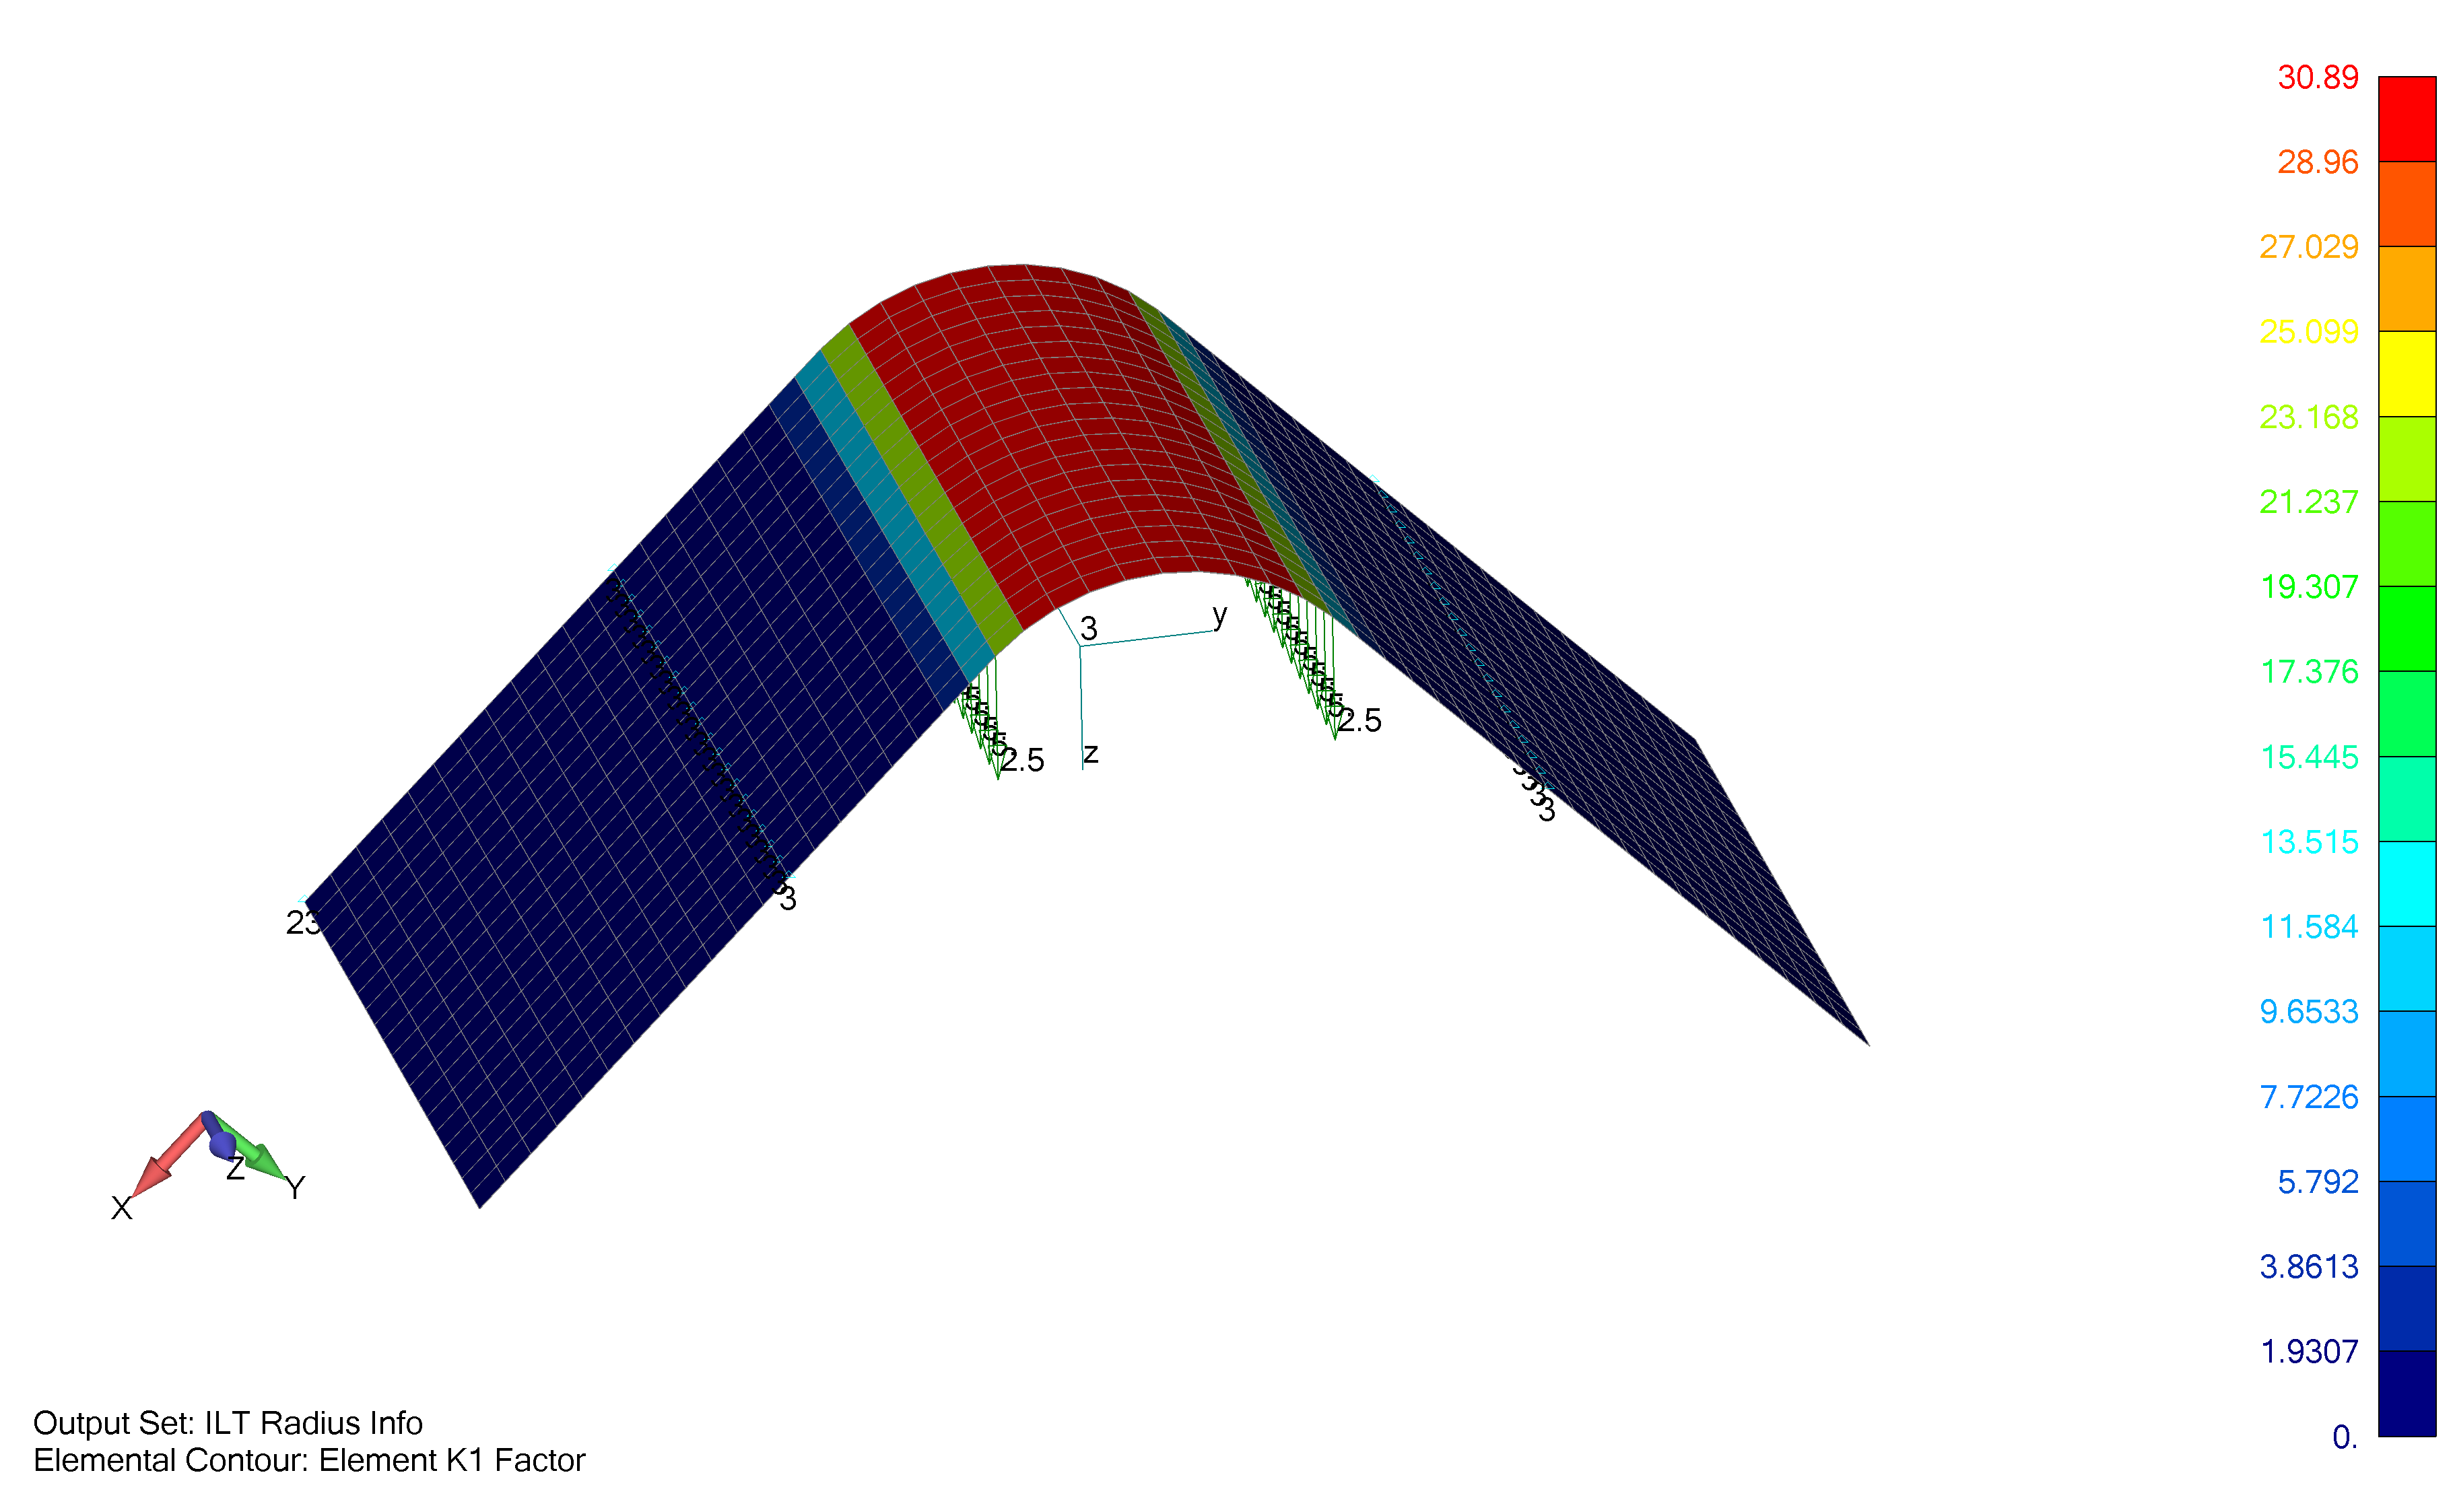
Figure V4 — D6415_4_point_bend.dat: ILT stress contour, peak 3,151.6 psi. Same view orientation; the L is shown in fixture position with the curve up. Compare to Kedward 2,995 psi (+5.2%) and to the simple end-moment result (+1.4%).
Figure V5 — Same deck: K1 curvature-factor diagnostic. Identical to Figure V3 since both decks share the same geometry. Validation summary
Both FE decks bracket the Kedward analytical within ±6%, the typical FE-vs-analytical pass band for shell-discretised curved-beam bending. The 1.4% inter-deck agreement confirms ILT Calc's recovery is loading-method-agnostic. Common Aerospace Composite Material SystemsFor reference, here are nominal published properties for several common aerospace CFRP systems, all from publicly available sources (manufacturer datasheets, NCAMP reports, NASA technical reports, CMH-17 / MIL-HDBK-17). These are nominal handbook values for educational and comparative use only — real design allowables depend on cure state, fibre volume fraction, environmental conditioning, and statistical basis (A/B-basis).
How to read these numbers
Recommended sources for design data
All values above are drawn from open / commercial publications. For real design qualification you'll need project-specific test data covering the actual layup, environmental conditioning matrix, and applicable A/B-basis statistical reduction per CMH-17 §8. |
||||||||||||||||||||||||||||||||||||||||||||||||||||||||||||||||||||||||||||||||||||||||||||||||||||||||||||||||